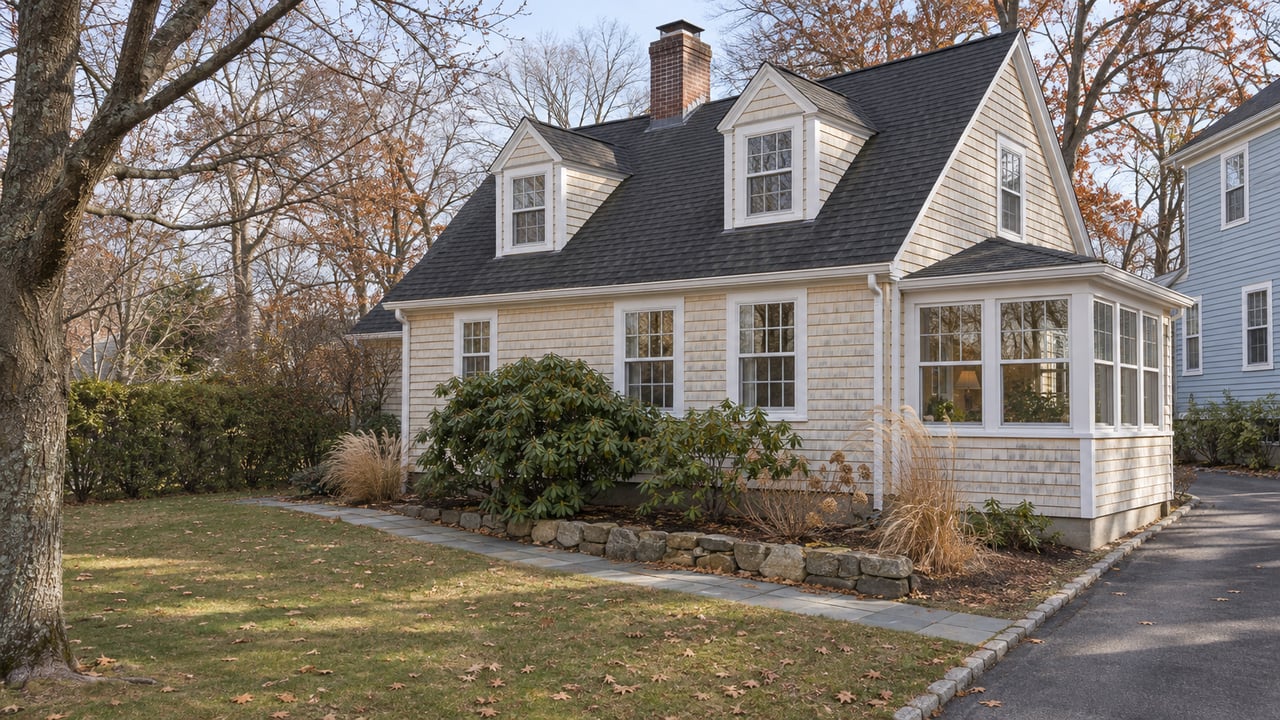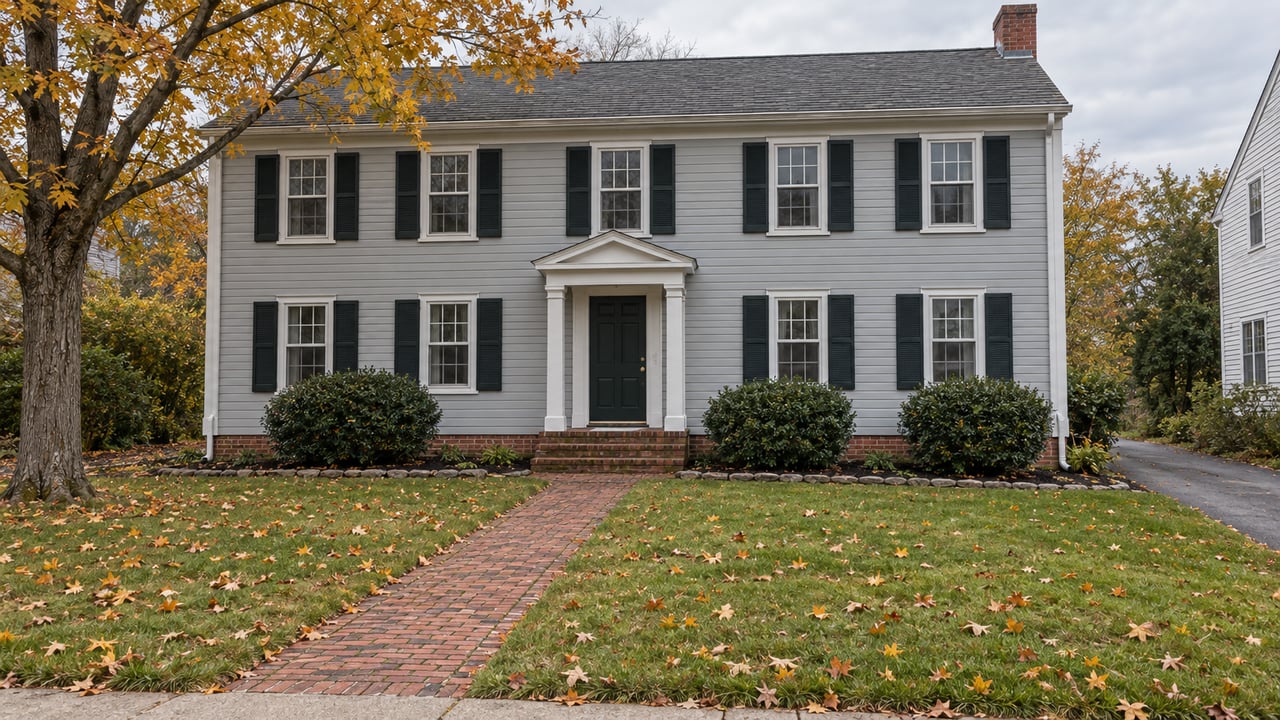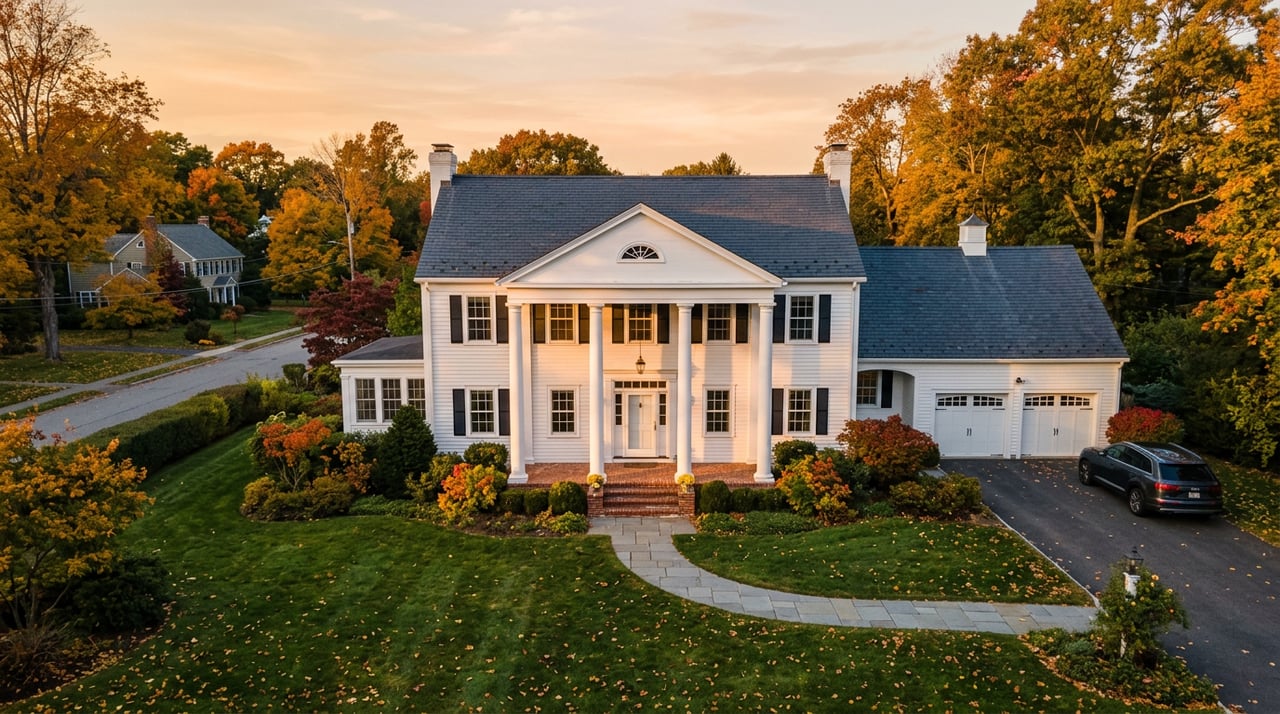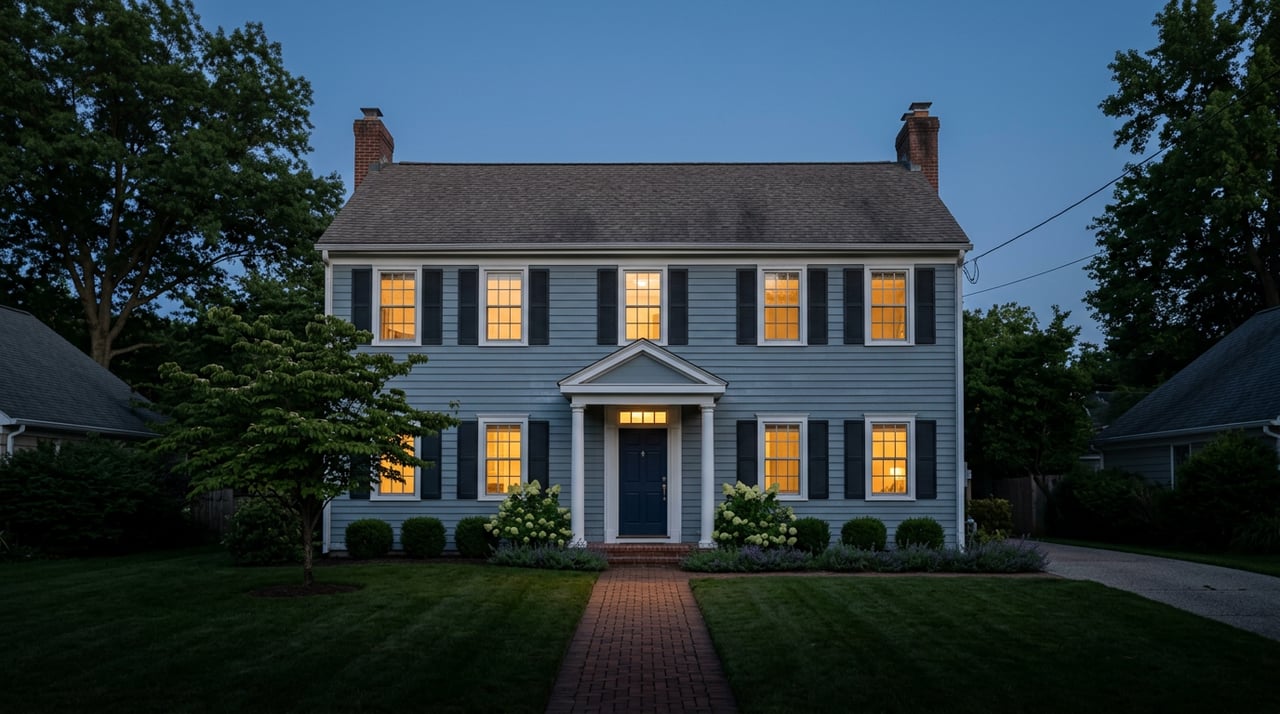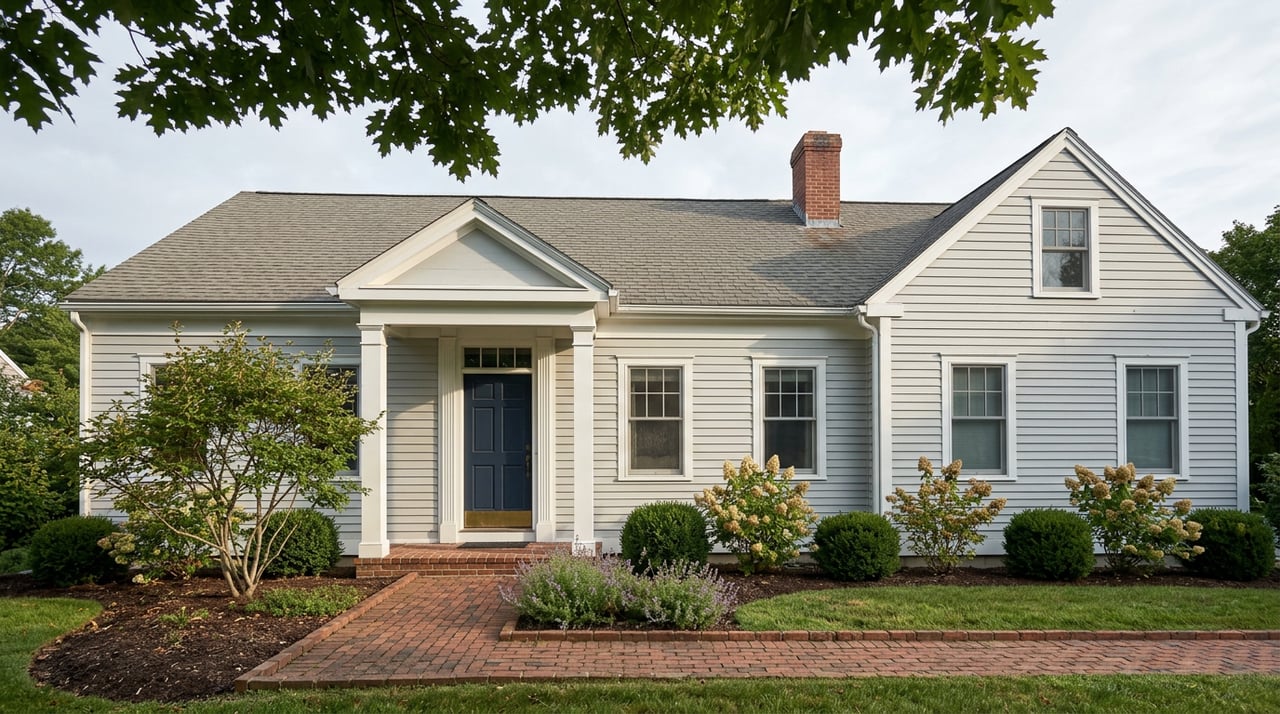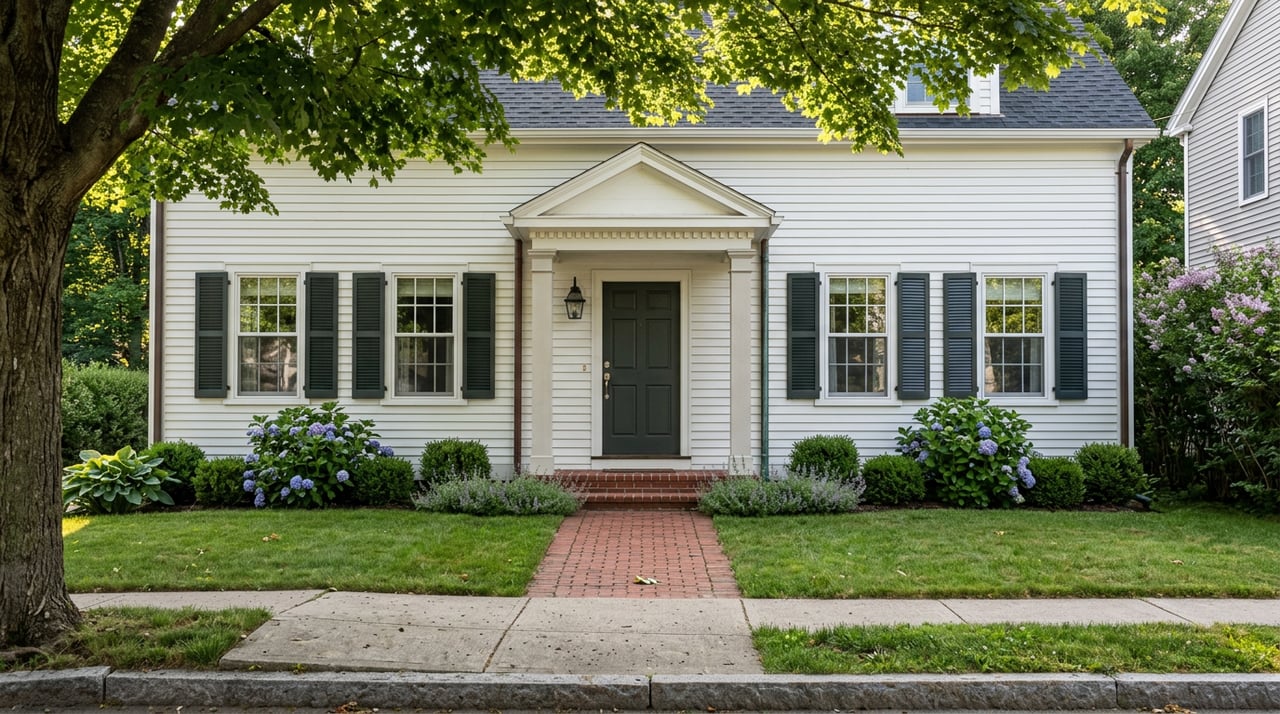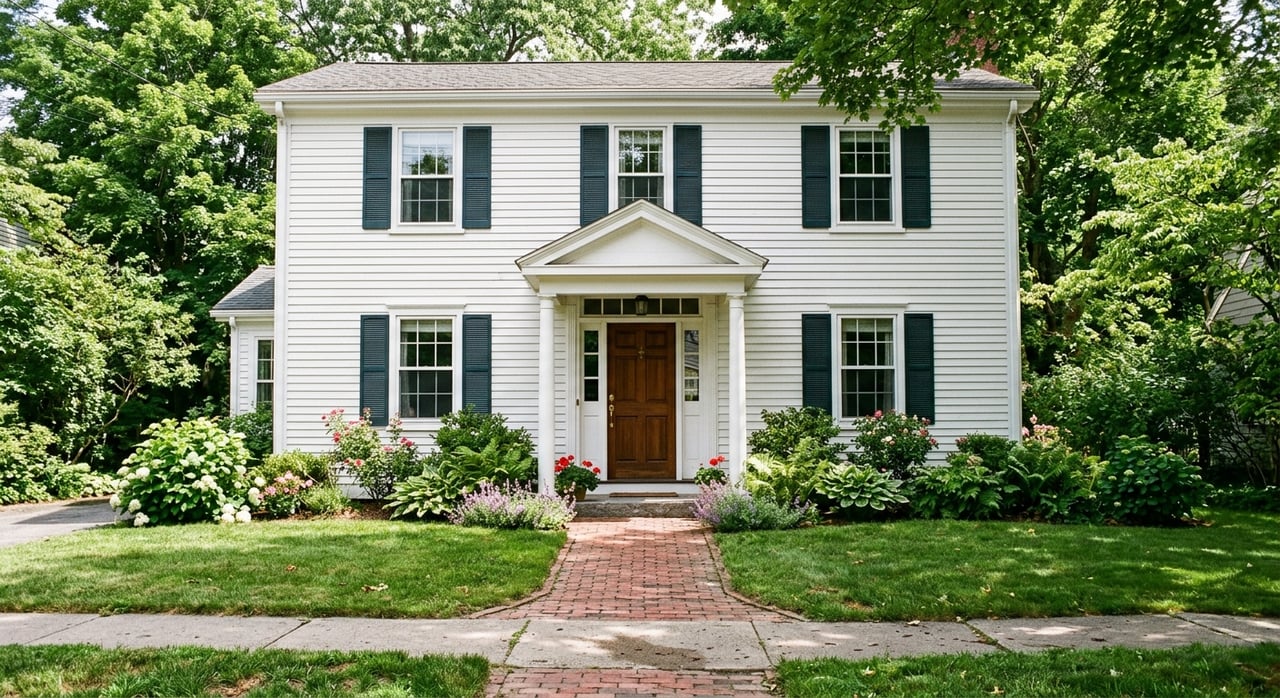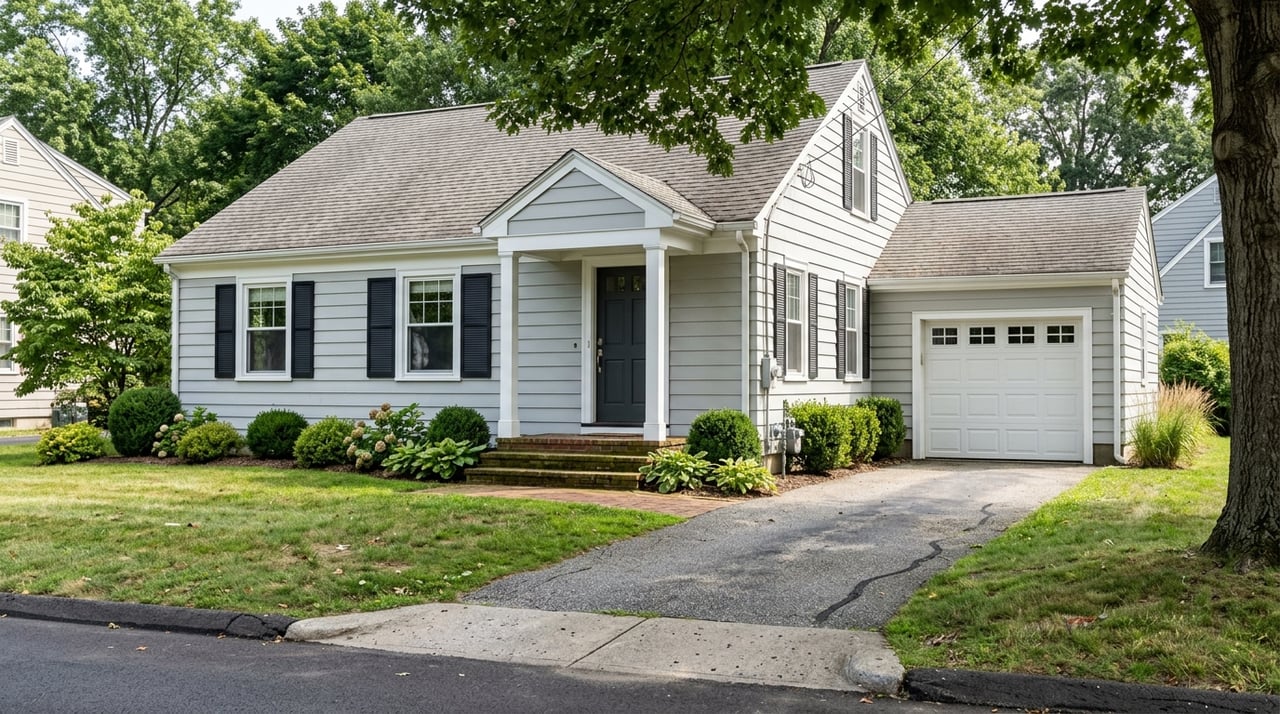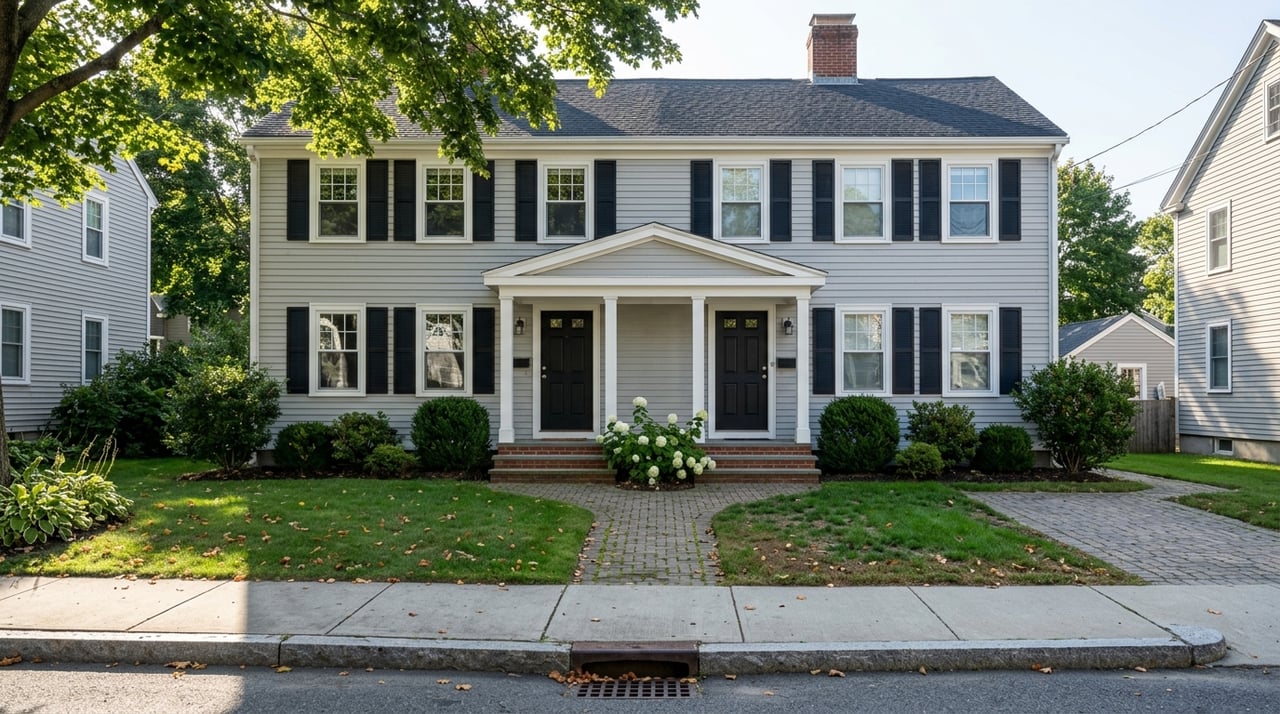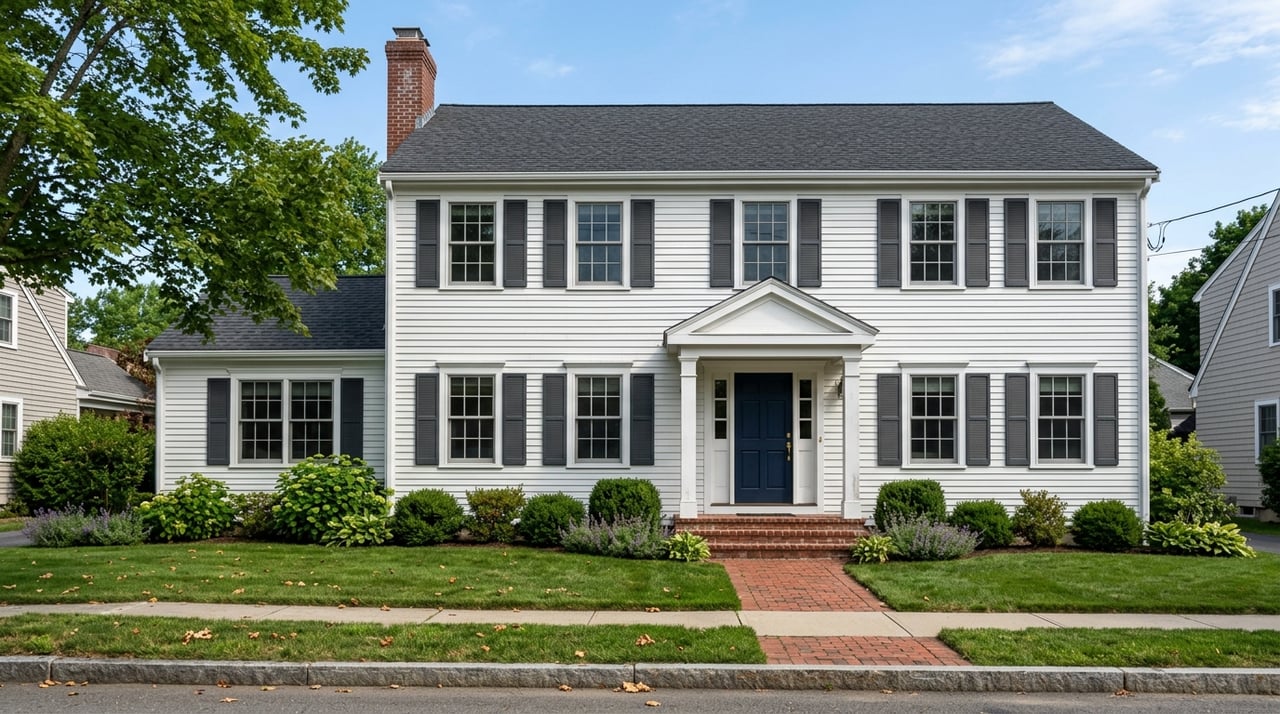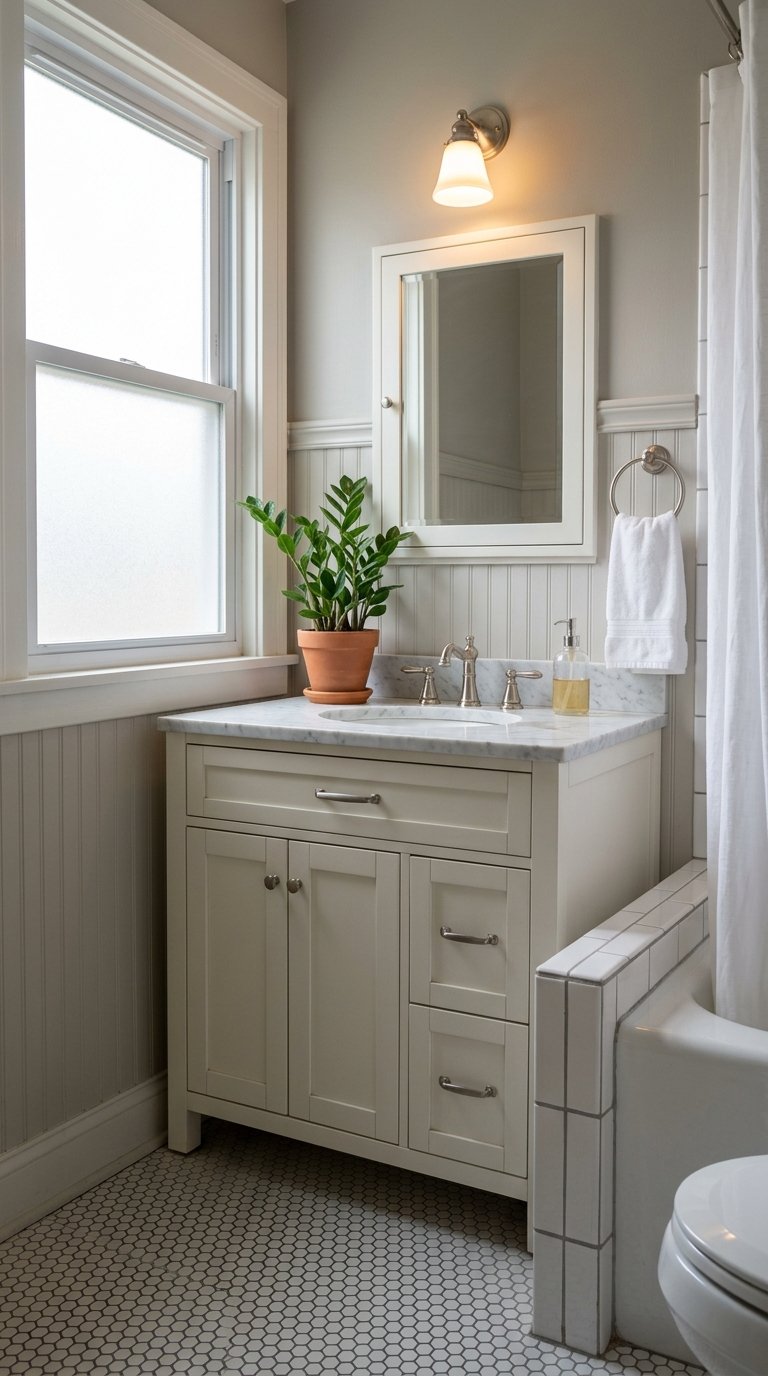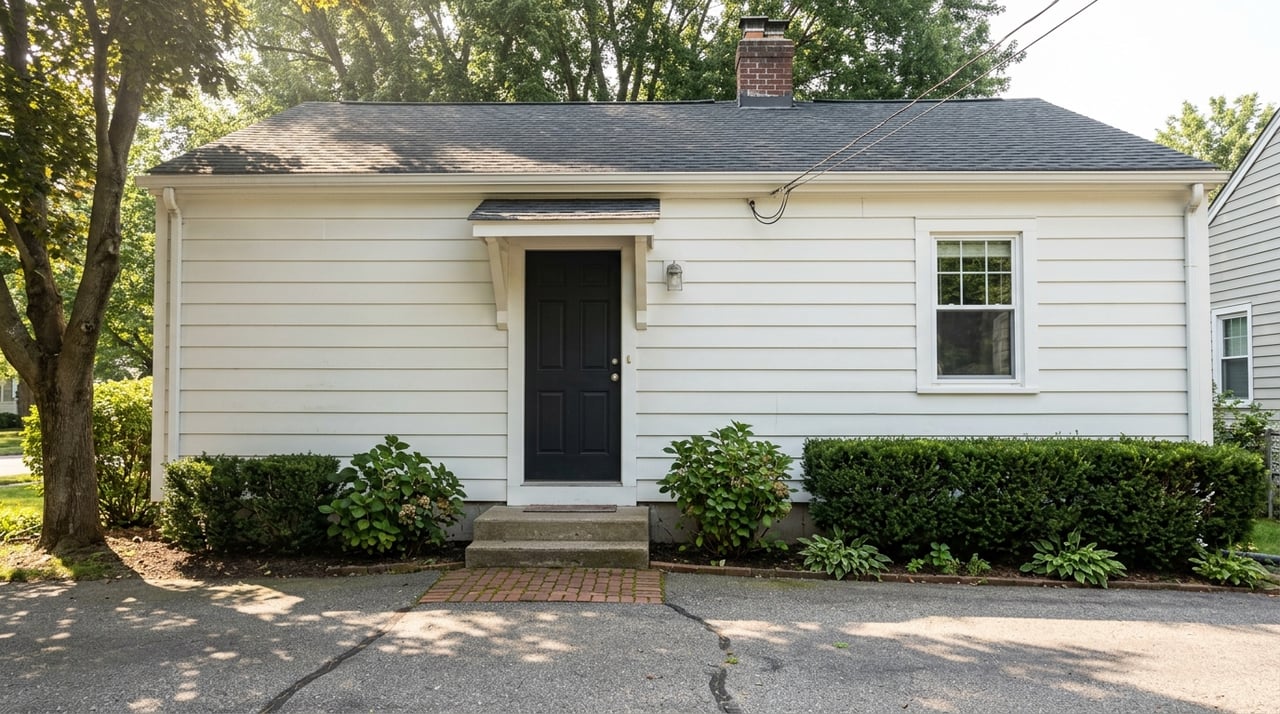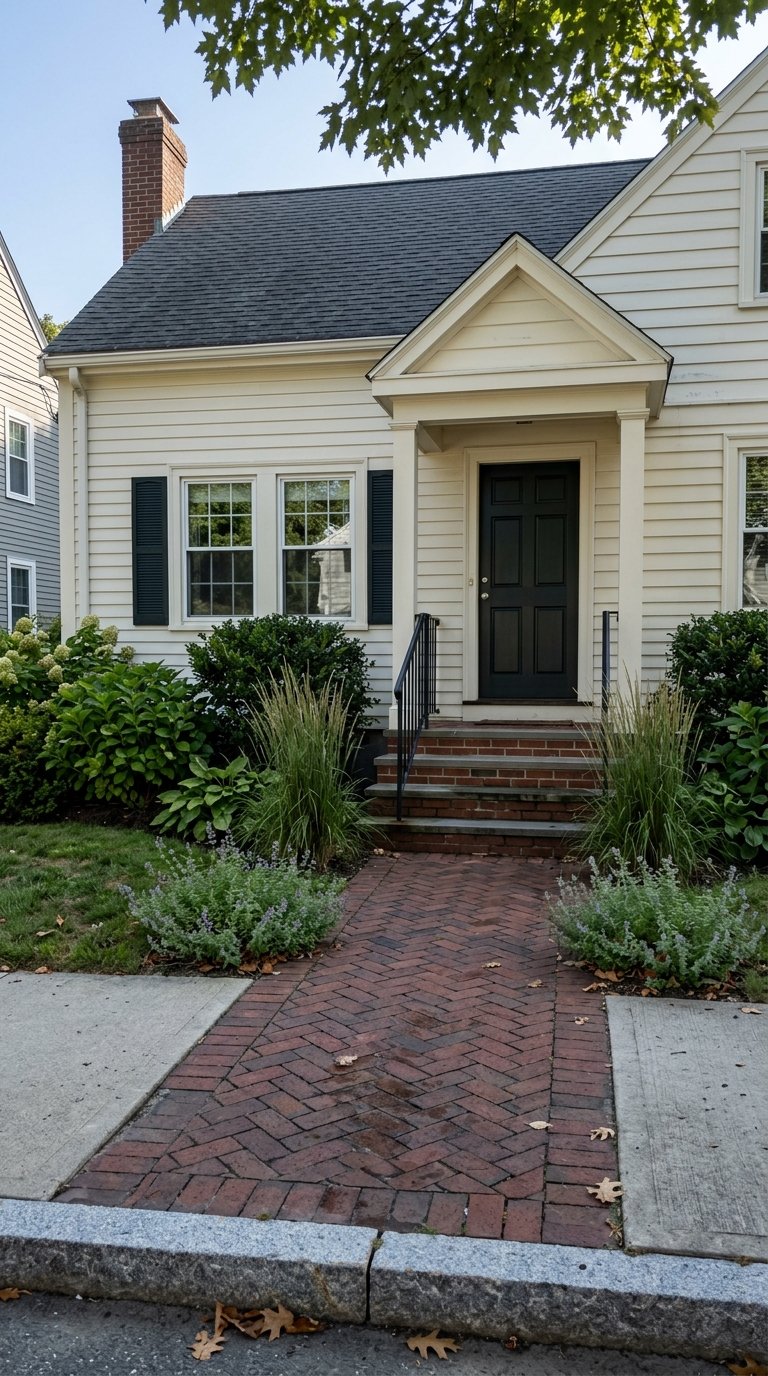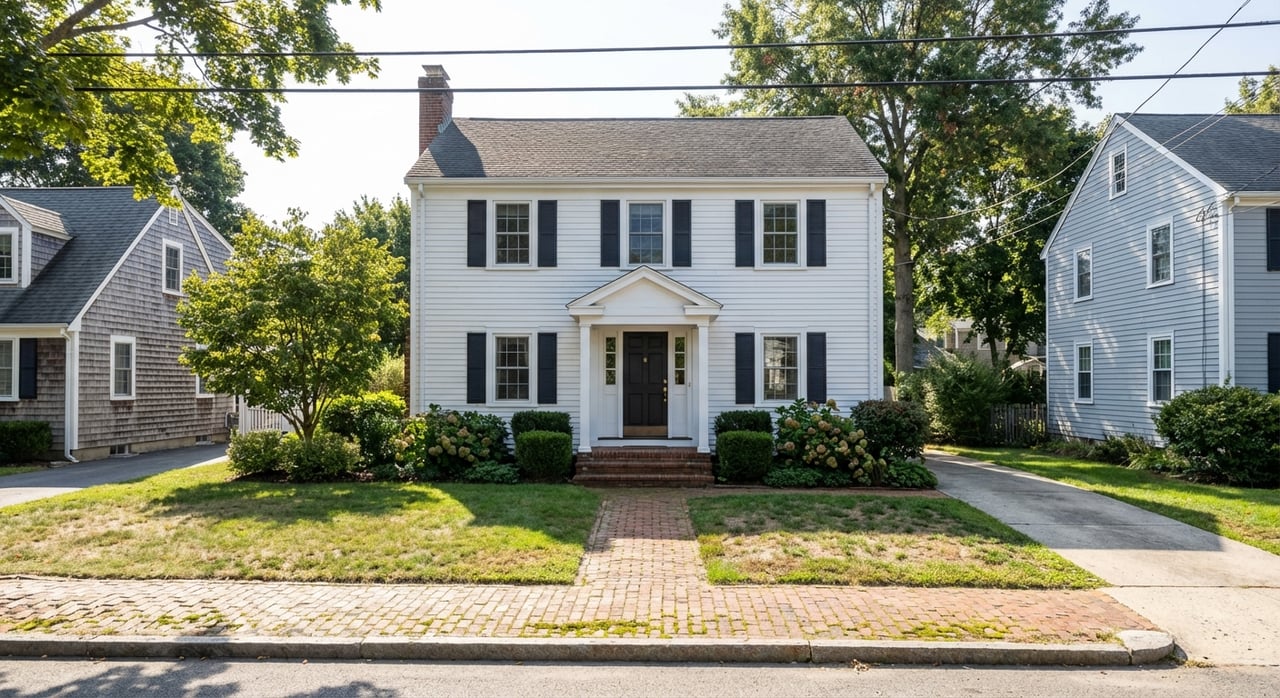
On August 10, 109 Shaw Road in Belmont sold for $1,305,000. Eighteen days later, 74 Shaw Road sold for $2,102,000. The two prices are almost $800,000 apart on the same street. Per square foot they are close: about $876 for the 1,490-square-foot house and about $919 for the 2,288-square-foot one, using the living areas in the Belmont Voice weekly transaction tables, which come from Banker & Tradesman data. Most of the gap is house size, and the market was the same for both.
This matters for anyone comparing Belmont with Newton, Watertown or Arlington this winter. The headline number for 2026 is lower. Belmont's single-family median for January through October 2026 is $1,605,000, down 11.1% from $1,805,000 over the same months of 2025, according to the Massachusetts Association of Realtors October 2026 Local Market Update for Belmont. Part of that drop comes from which houses sold, and part of it shows up in how long homes sat this fall. A buyer who budgets around the headline figure alone will misjudge both.
More Houses Came to Market, and More of Them Were Modest
A median is the price of the middle sale, so it shifts whenever the mix of homes that sell shifts. In 2026 that mix grew. Through October, Belmont had 153 new single-family listings, compared with 122 in the same period of 2025, and 105 closed sales, compared with 88.
Before the extra listings arrived, Belmont was a tight market. In May 2026, the Belmont Voice reported that demand stayed steady while there were fewer properties to compete for, and local agents pointed in part to owners staying put in homes with low-rate mortgages. New listings for January through October 2026 ran 25.4% ahead of the same months of 2025, which suggests that hold has started to loosen. The weekly sales records suggest that many of the homes that came loose are the smaller, older single-families Belmont has plenty of.
From early August to early October, the Belmont Voice tables list single-family sales such as:
- 124 Orchard Street, 1,323 square feet, $1,205,000
- 22 Chilton Street, 1,290 square feet, $1,000,000
- 45 Simmons Avenue, 1,508 square feet, $1,210,000
- 20 Preble Gardens Road, 1,664 square feet, $1,475,000
- 74 Van Ness Road, 1,632 square feet, $1,450,000
- 36 Richardson Road, 1,790 square feet, $1,500,000
When more houses under 2,000 square feet sell, the middle sale gets smaller, and the median drops further than any single house's value does.
What a Square Foot Cost, August Through Early October
Price per square foot shows this more clearly. The figures below are sale price divided by the living area in the Belmont Voice tables, for a selection of single-family closings between August 3 and October 2, 2026.
| Address | Sale date | Price | Living area | Price per sq ft |
|---|---|---|---|---|
| 315 Channing Rd | 9/24/2026 | $1,620,000 | 1,713 sq ft | about $946 |
| 74 Shaw Rd | 8/28/2026 | $2,102,000 | 2,288 sq ft | about $919 |
| 124 Orchard St | 8/4/2026 | $1,205,000 | 1,323 sq ft | about $911 |
| 74 Van Ness Rd | 9/24/2026 | $1,450,000 | 1,632 sq ft | about $888 |
| 42 Hillside Ter | 9/4/2026 | $2,481,500 | 2,818 sq ft | about $881 |
| 109 Shaw Rd | 8/10/2026 | $1,305,000 | 1,490 sq ft | about $876 |
| 156 Common St | 9/30/2026 | $2,450,000 | 2,823 sq ft | about $868 |
| 17 Eliot Rd | 9/14/2026 | $1,550,000 | 1,913 sq ft | about $810 |
| 40 Goden St | 9/11/2026 | $2,135,000 | 2,715 sq ft | about $786 |
| 81 Brettwood Rd | 9/30/2026 | $2,005,000 | 2,773 sq ft | about $723 |
| 233 Rutledge Rd | 8/7/2026 | $2,075,000 | 3,016 sq ft | about $688 |
| 10 Radcliffe Rd | 10/2/2026 | $1,175,000 | 1,905 sq ft | about $617 |
| 4 Van Ness Rd | 9/25/2026 | $1,199,000 | 2,050 sq ft | about $585 |
| 53 Birch Hill Rd | 9/11/2026 | $2,052,000 | 3,843 sq ft | about $534 |
In this set, the smaller houses carry the highest price per foot. Several houses under 1,800 square feet sold between roughly $875 and $950 a foot. Large houses sell for less per foot, because the last thousand square feet adds less than the first. 53 Birch Hill Road has 3,843 square feet on a 22,030-square-foot lot and sold at about $534 a foot. 1 Hay Road has 2,866 square feet on 35,780 square feet of land and came in near $579.
The wide spread inside one size range comes from condition, which a sales table can't show. 4 Van Ness Road and 74 Van Ness Road are on the same street and sold a day apart. Per square foot they differ by about $300, and the smaller house sold for more in total. That gap is roughly what a buyer pays to skip a kitchen, a set of baths, or a mechanical overhaul. Comparing a Belmont house to the town median tells you very little. The useful comparison is to the closest recent sale in the same condition.
The $8,000,000 sale on Concord Avenue isn't in the table. 504 Concord Avenue closed on September 1 for $8,000,000, with 6,286 square feet of living area on 94,996 square feet of land. It is a single estate, and it says nothing about what a colonial near Belmont Center or Cushing Square should cost.
Where Buyers Actually Gained Ground This Fall
The clearest change this fall was in how long homes sat and how far sellers came down from their first asking price. For January through October 2026, Belmont single-family sellers received 98.9% of their original list price, the same as in 2025. Through October, sellers as a group got as close to their asking prices as they had the year before.
The fall months were different. In September 2026, single-family homes sold for 93.3% of original list price after a cumulative 59 days on market, compared with 101.0% and 30 days in September 2025. In October 2026 the figures were 95.9% of original list and 69 days on market, compared with 41 days a year earlier. Inventory was 29 homes against 20, and months of supply rose from 2.1 to 2.8. In August, by contrast, sellers got 100.8% of original list after 20 days.
Taken together, a well-priced Belmont house still sold close to its value this fall. A house that went on the market too high sat, and it eventually sold below its first asking price. For a buyer, the opening is in listings with 45 or more days on market and a price cut behind them. Fresh listings aren't where the room is. The MAR reports say themselves that one month of Belmont data can look extreme because the sample is small. The August 2026 median was $1,449,000, down 38%, and the July median was $1,862,500, up 1.8%. Neither month is the trend. The trend shows up in days on market and price received, and those have pointed the same way since September.
Belmont Condos Softened More
Belmont's condo market softened more than its houses, and earlier. Through October 2026 there were 43 condo closings, compared with 61 in the same period of 2025, and the median fell 7.6% to $850,000. In October, 23 condos were for sale, compared with 13 a year earlier, which works out to 5.3 months of supply. Single-family supply was 2.8 months that month, so a condo buyer has close to twice as much to choose from.
The recent condo sales cover a wide range. 38 Slade Street sold for $700,000 at 1,097 square feet, 23 Pine Street Unit 1 for $775,000 at 1,180 square feet, and 113 White Street Unit 1 for $1,015,000 at 1,816 square feet. 25 Cross Street Unit 2 sold for $710,000 at 1,812 square feet, and 10 Creeley Road Unit 1 closed on October 5 for $815,000. At the top, 65 South Cottage Road Unit 119 sold for $1,800,000 and 3 Meadows Lane Unit 106 for $1,760,000, each with more than 2,700 square feet. With so few sales, two of them can set a month's median. That happened in September, when MAR reported 2 condo closings and a $1,235,000 median. October's $580,000 median comes from 3 sales and has the same problem. For a first purchase in Belmont, the number that matters is the 23 units for sale. Our first-time buyer's roadmap for Belmont walks through the steps.
December Usually Ends the Buyer's Window
The leverage described above depends on supply, and Belmont's supply drops sharply late in the year. In December 2025, only 4 single-family homes were for sale in town, about 0.4 months of supply, and sellers that month received 96.5% of original list price. As of October 2026 there were 29. The homes that sit through the holidays have usually been on the market for a while, and their sellers have often already cut the price once. That combination is where a careful buyer has the most room. But there are fewer such homes every week until the spring listings arrive.
For a buyer comparing towns, Belmont's 11.1% lower median overstates the discount, because more of 2026's sales were smaller houses. Small, well-kept houses still sold for $875 to $950 a foot between August and early October, and sellers who priced to those sales did well. Where buyers gained the most this fall was time. Some sellers waited for prices from earlier in the year that buyers wouldn't pay, and those listings are where a November or December offer has room. The Belmont neighborhood guide covers the town around those houses, from Cushing Square to Waverley, and our look at what filled the gap on Trapelo Road this summer shows what has been opening there lately.
If a Belmont house you're watching has passed 45 days on market, talk with Anne Kennedy about how its price per square foot compares with this fall's closings nearby before you write an offer. If you own in Belmont and are wondering whether to list before the December slowdown or wait for spring, start with a free home valuation built on the same sales.